
Database diagrams
Generate an ER diagram from a legacy schema
Turn a twenty-year-old Caché namespace into a diagram you can actually hand to a colleague.
- Tables, views, columns, keys, relationships
- As many diagrams per database as you like
- Diagrams stored in the database itself
- Kept in step with schema changes
- Copy a diagram to the clipboard
A colleague joins the team and asks how the order data hangs together. An auditor would like to see the data model. You are about to change a table and want to know what references it. Three good questions, and in a namespace with four hundred tables the fastest answer to all of them is a picture. Database diagrams draw that picture from the live schema, so what you show is the model as it is today rather than as a Visio file remembered it in 2011 — and the schema knowledge that used to live in one colleague's head becomes something the whole team can open. Long-lived Caché and IRIS systems accumulate a lot of schema; this is how you make it legible.
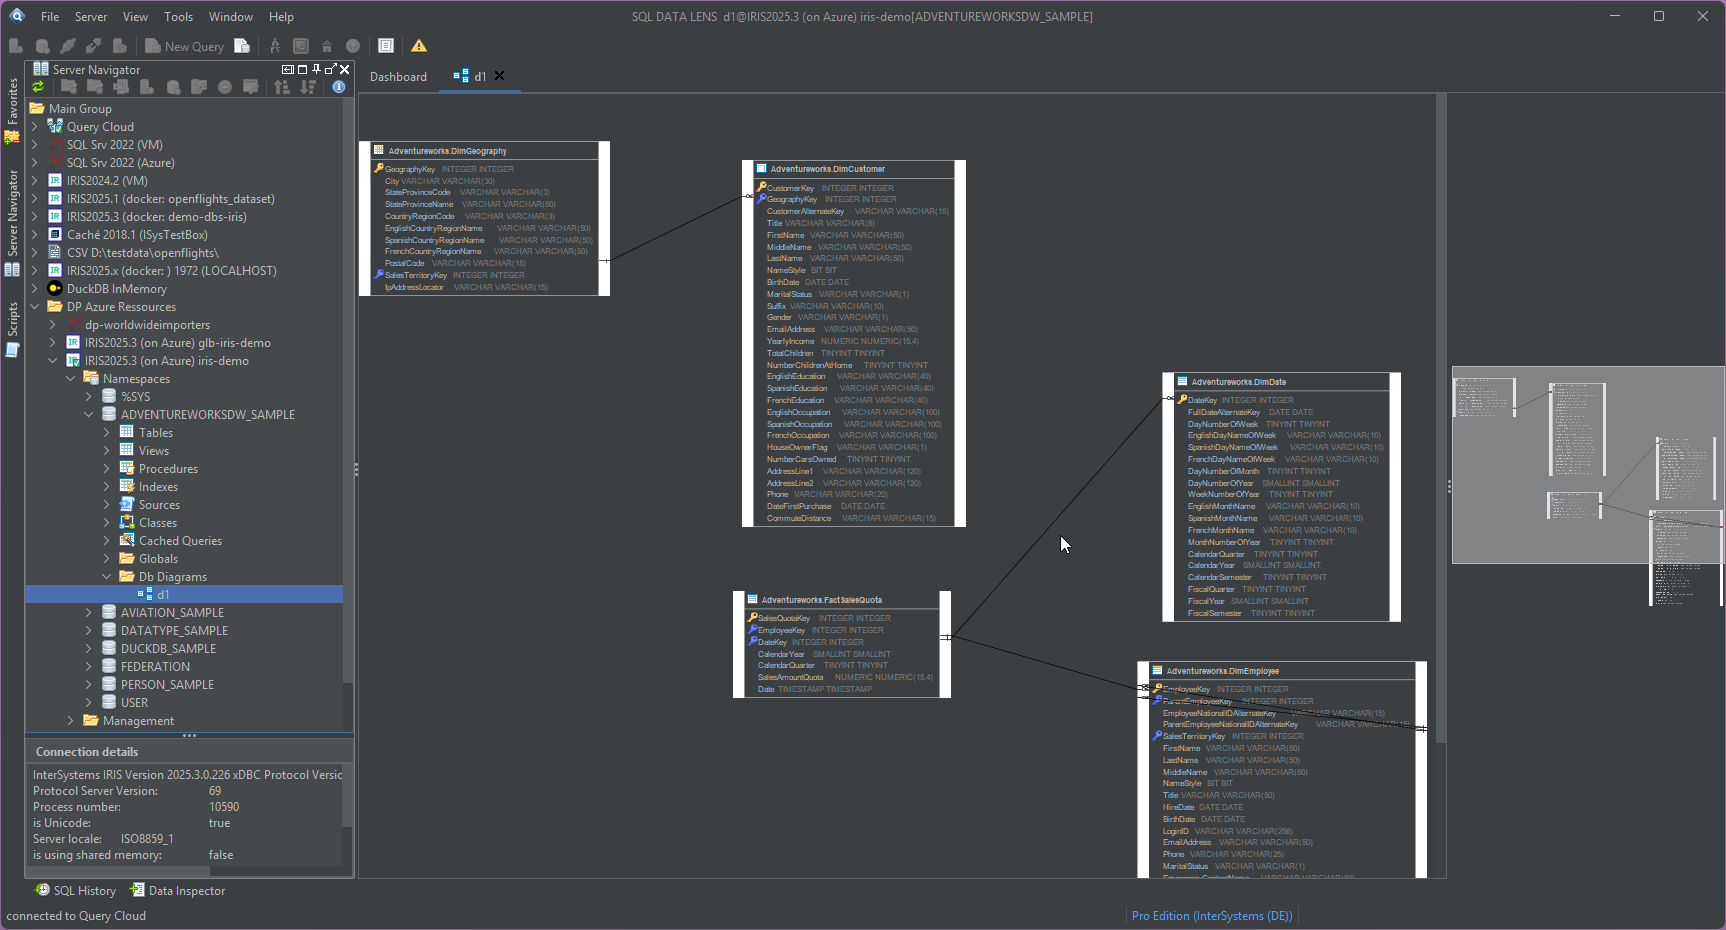
The structure of the database, drawn
A database diagram shows the structure of the database graphically. To visualise a database you create one or more diagrams illustrating some or all of its tables, columns, keys and relationships. Views are supported as well as tables, and system objects appear if you have chosen to show them for that connection.
The word "some" is what makes this usable. Nobody wants one diagram of four hundred tables; that is a wall poster, not documentation. For any database you can create as many diagrams as you like, and each table may appear on any number of them. So the practical pattern is a set of small diagrams — one for orders, one for patient master data, one for the integration tables — each of which fits on a page and answers one question. The same customer table sensibly shows up on several of them.
Diagrams stored with the schema they describe
Each diagram you create is stored in the associated database. This is a deliberate decision, and it is the main reason these diagrams stay accurate while a Visio file does not. The diagram travels with the namespace: restore the database somewhere else and the diagrams come with it; a colleague connecting to the same namespace sees the diagrams you drew, without a file being emailed anywhere.
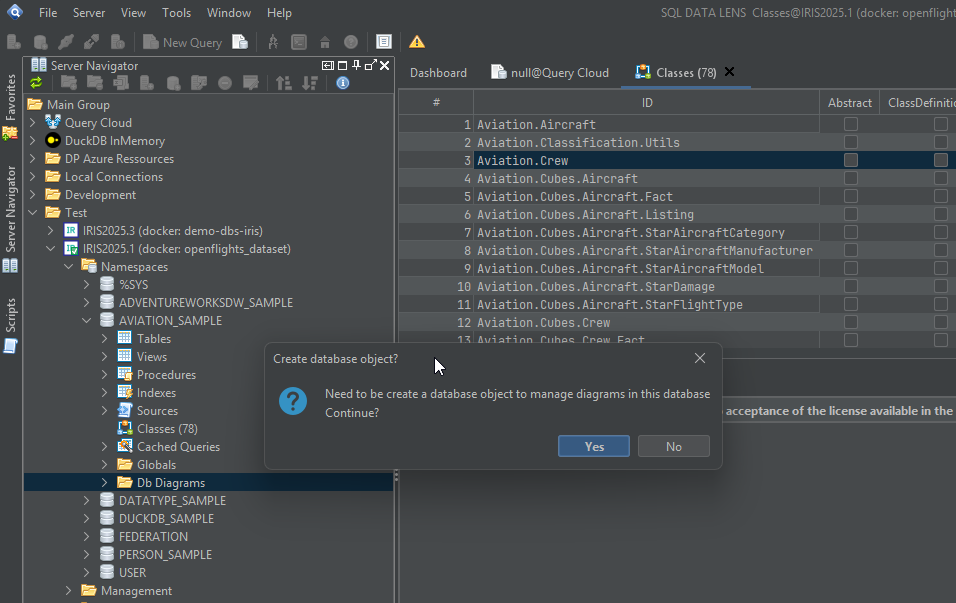
That storage needs one table, so the first time you click on the Database Diagrams folder of a database, you are asked "Create required objects to manage diagrams in this namespace?". This is not an error message; it is a permission request. The tool will not create objects in your database without asking.
- Choose No and nothing is created — and you will not be able to use database diagrams in that namespace.
- Choose Yes and one table is created to hold the diagrams, and the feature becomes available.
Worth knowing before you answer on a production instance: the answer is remembered, the table holds only diagram definitions, and if the policy at your site forbids creating objects in production then draw the diagram against a restored copy or a test namespace with the same schema instead.
Diagrams that keep up with the schema
If you modify a table outside the diagram editor, the change is picked up automatically in any saved diagram that contains it. Add a column through DDL, drop a constraint, deploy a class change — the diagrams reflect it rather than quietly going stale. That is the difference between a drawing and a view of the schema, and it is why a diagram created two years ago is still worth opening.
Where a diagram tells you the shape, the Table Viewer tells you the detail: the columns tab marks primary and foreign keys and names the referenced table on the foreign key tooltip, and the IRIS tabs add row counts, selectivity and storage sizes. Reading a diagram and then checking extent sizes is usually enough to work out which tables in an unfamiliar schema are the important ones.
Rolling out 4.02 to a team that shares diagrams? Do it together. Diagrams are saved in a new, safer file format from this version, and a diagram saved by 4.02 cannot be opened by a colleague still on an older one sharing the same server. Diagrams saved by older versions still open here exactly as before, so the incompatibility runs one way only — but a staged rollout across a team is the wrong shape for it.
Opening, editing and sharing a diagram
Diagrams are opened from the Server Navigator: expand the Database Diagrams folder of the database and click the name of the diagram you want. From there you can view the structure or edit the diagram — add tables, remove them, rearrange the layout so the relationship lines stop crossing.
For sharing, a diagram can be turned into an image and pasted into another application. Open the diagram, right-click a blank area of the canvas and choose Copy Diagram to Clipboard. Paste it into the specification, the ticket, the slide deck or the email — which is normally the actual deliverable when somebody asks how the data model works.
What a diagram is good for on an established namespace
Three jobs come up again and again:
- Onboarding. Four small diagrams beat forty pages of prose for a developer who has never seen the system.
- Impact analysis before a change. Draw the table you intend to alter plus everything that references it, and the conversation about risk becomes concrete.
- Documentation you can produce on demand. When an audit or a migration project asks for a data model, generating it from the live schema is both faster and more truthful than editing an old drawing.
For classes and their relationships behind the SQL projection, the Class Viewer is the companion view — a diagram shows the foreign keys, the class shows the computed properties and class queries that a diagram cannot express.
Turning an undocumented, long-established namespace into something you can hand to a colleague takes an afternoon rather than a project. Download SQL DATA LENS and draw the first diagram against a test copy of your own schema.
Explore your IRIS data from SQL down to globals
Download, unzip, connect. Your first namespace is on screen in about three minutes.
Windows 10, 11 and Windows Server (64-bit) · ~132 MB · version 4.02 · full 30-day Pro trial included