
SQL performance
Find the queries and indexes that cost you time
Scan for redundant indexes and unindexed foreign keys, hunt down expensive cached queries, read execution plans and profile with PTools.
Unique to SQL DATA LENS
- Scan profiles: Quick, Standard, Deep
- Findings from the server’s own plans
- IRIS execution statistics in the editor
- Cached query analysis and PTools profiling
- Table and global sizes
The report is never precise
"The overnight job took four hours instead of forty minutes." "The patient search screen hangs." "It was fast yesterday." Nobody hands you a statement, a plan and a row count. So the work splits into four steps, and the tools on this page follow them: find the cause, confirm it, fix it, verify that the fix is what changed.
- Find the cause — scan the schema, look at what is cached, read the plan.
- Confirm it — profile the statement and see where the time goes.
- Fix it — statistics, an index, or a purged cached query.
- Verify — re-run the profile and compare.
Step 1: find the cause
Scan the namespace for schema problems
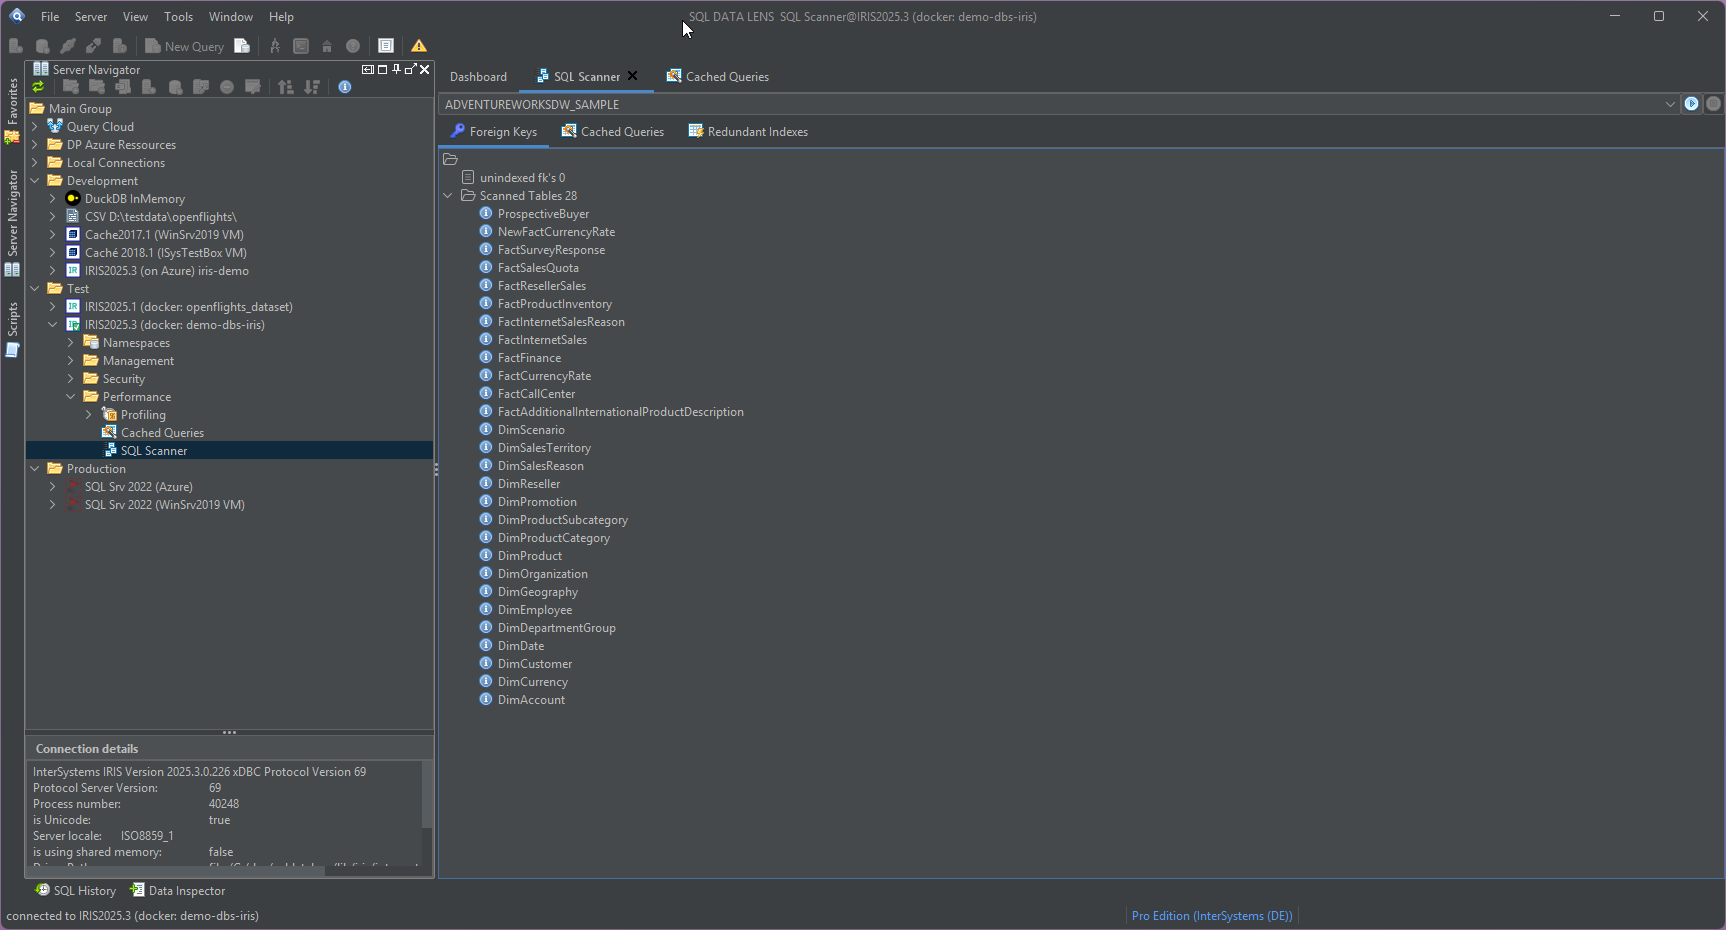
One press of Start scanning runs every check and fills every tab. Findings are sorted by severity across all of them, so an error is never buried under thirty warnings, and each finding carries a reason and — where one can be generated — a suggested statement you can copy or open in an editor. The scanner itself never executes anything.
From the catalogue
- Foreign keys with no index. A referential constraint with no index on the referencing column. Every delete on the parent table turns into a full scan of the child table to check the constraint — the classic cause of a delete that takes minutes. A key counts as indexed only when an index carries its columns as the leading columns; composite keys are judged as a whole. (This check returned nothing at all on IRIS and Caché until 4.00. Corrected, it finds 40 unindexed foreign keys in the shipped AdventureWorks sample where the old one found none.)
- Redundant indexes. An index whose column list is a prefix of another index's. It costs you on every insert and update and buys you nothing on read. Unique indexes, indexes with their own data columns and the IRIS structural indexes are excluded, because dropping those is not the same question.
- Stale or missing table statistics. Tables whose optimiser statistics were never gathered, are older than 90 days, were invalidated by changed rows, or came from too small a sample — plus tables with automatic collection switched off and indexes that were defined but never populated.
- Index type advice for IRIS. Index types are invisible over JDBC, so they are read from the class dictionary and compared against column cardinality: standard indexes on low-cardinality columns that want to be bitmaps, bitmaps on high-cardinality columns, bitmap indexes with no bitmap extent index, and indexes the optimiser cannot select at all.
From the server's own plans and counters
Since 4.01 the scanner reads the execution plans the server has already built and the counters it has already recorded, instead of estimating from statement text. That turns advice into measurement:
- a large table that cached plans walk end to end instead of using an index, ranked by measured server time;
- an index no cached plan reads, but that is still maintained on every write;
- a frozen plan;
- a predicate a plan cannot use an existing index for;
- up to three missing-index suggestions per table, drawn from the real query pattern rather than a general rule;
- a sort that spills to a temporary file.
On PostgreSQL, SQL Server and MariaDB/MySQL the unused- and unread-index findings come from those servers' own usage counters too — this is no longer an InterSystems-only capability.
From real data, on the Deep profile
The deepest level samples rows, and it exists to settle the questions an estimate cannot: a bitmap index confirmed or ruled out by an actual count; a single value that alone carries most of a table, so no index would help; and a genuine mismatch between the statistics the optimiser plans against and the data itself. That last one is reported only where the numbers really prove it — a sample can show that the statistics claim too few distinct values, while the other direction needs a full count.
The Profile button next to Start scanning chooses between the three: Quick (catalogues only, safe on production), Standard (adds plans and counters) and Deep (adds data sampling). Where the scanner cannot answer a question with certainty, or has nothing to work with — an older server, an instance whose execution counters have not been written yet — it says so on the Scanned Objects tab, which lists every table that was checked, the schemas excluded as system objects and any check that could not run, with the reason. It does not show you a clean result it has not earned.
The SQL Scanner needs a paid licence (Named User or above). Everything else on this page — plans, the cached query analyser, PTools, the execution statistics below, table and global sizes — is in every edition.
Look at what IRIS has cached
InterSystems IRIS does not re-plan a statement every time you run it. On the first prepare it builds a plan and stores it as a cached query, keyed on the statement text with the literals stripped out. Every later execution of that statement reuses the stored plan.
That is why "it was fast yesterday" is a real diagnosis and not a shrug. The plan was built when the table held eight thousand rows and the optimiser quite reasonably chose a scan. The table now holds four million rows. The statement has not changed, the data has, and the plan is frozen in between. Nothing in the query text tells you this — you have to look at the cache.
The cached query analyser lists the cached queries in a namespace with their statement text, execution counts and the time they have cost, so the expensive ones sort to the top. From the same list you can delete a single cached query or clear a set of them, which forces the next execution to re-prepare against today's statistics.
It lives under Performance > Cached Queries and under every namespace node, and it is per namespace in the literal sense: open it for three namespaces and you get three lists, each tab labelled with the namespace it belongs to, each count matching its own grid, and Delete Cached Query acting on the one you are looking at. The SQL Scanner no longer has a Cached Queries tab of its own — its findings from the cache were always workload findings, and those are in the scanner's Findings tab in full, sortable by severity and by share of measured load.
Read the execution plan
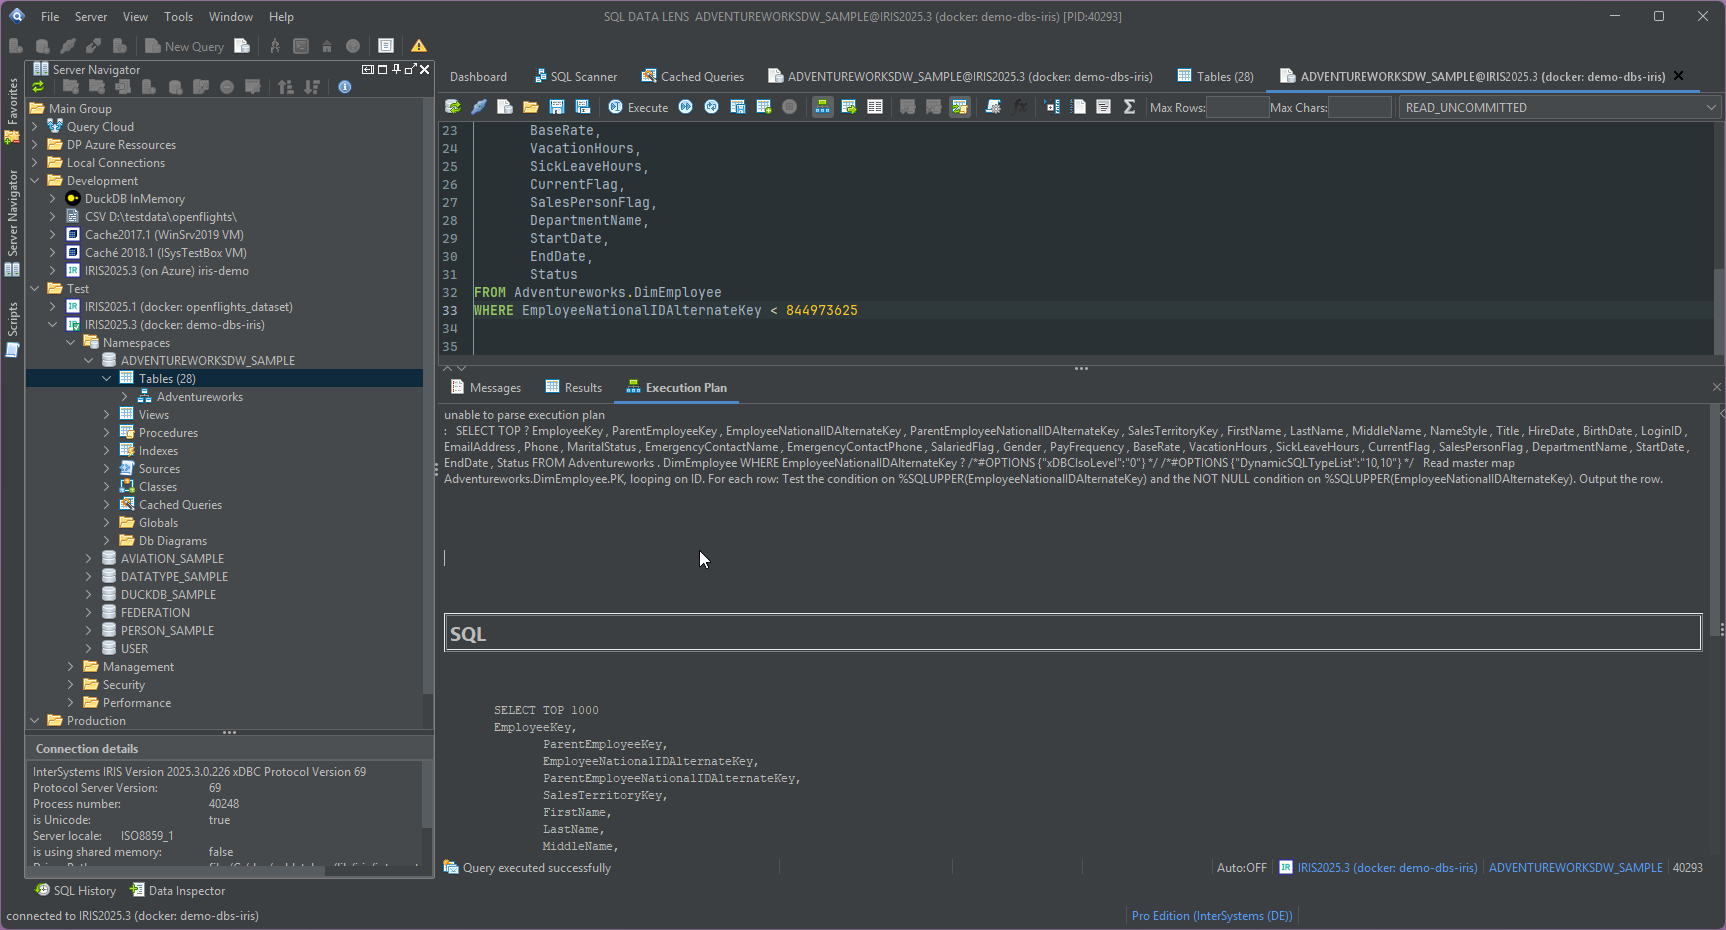
Plans are shown in the SQL editor itself, next to the statement that produced them. You do not copy the query into a second tool to find out that the loop you expected to be driven by an index is a full scan of the outer table.
Step 2: confirm it with numbers
The cost of every statement you run, as you run it
Since 4.01 the SQL editor can show IRIS execution statistics next to the row count and the elapsed time: global references, commands executed, disk reads with their latency, and the name of the generated cached query class. Global references are the number that matters most on IRIS, because they are what the work actually costs — two statements that both "take 1.2 seconds" are not the same statement if one of them touched forty times as many globals.
Changed in 4.02: off by default for a newly opened editor. Collecting these statistics on every statement has a cost, so a fresh SQL editor no longer turns it on for you. The chart button in the editor toolbar (or Tools ▸ Settings ▸ InterSystems IRIS / Caché ▸ SQL editor) switches it back on, either for just that editor or as the new default for editors you open afterwards — and if you had already switched it on before 4.02, that choice is kept. Greyed out on connections that are not IRIS or Caché.
The cached query class name is a link: click it to open that query in the Cached Query Analyzer, or right-click for the generated class source, the query plan, a MONLBL command line, or to purge it. Run a script and you get the sum plus one line per statement in the Messages tab, which answers "which statement was the expensive one?" without bisecting the script by hand. The numbers also go into the SQL History as a sortable Global refs column and into its CSV export, so today's run can be compared with last week's. Works on IRIS and Caché.
Comparing against the Management Portal? Run the query there a second time first. The Portal's first query in a server process pays that process's warm-up on top, so its number can look far higher for exactly the same statement.
Profile the statement with PTools
A plan tells you what the optimiser intends. Profiling tells you what actually happened. SQL DATA LENS drives IRIS's own PTools and PStats instrumentation: run the statement under the profiler and you get per-module counts of rows processed, global references and time, rather than a single total that leaves you guessing which part of the plan was expensive.
This is the step that stops you from optimising the wrong thing. A plan with an ugly-looking scan over a 300-row lookup table is not your problem; a tidy index loop executed 1.2 million times is.
Step 3: fix it
Statistics, and why new statistics may not take effect
The optimiser plans against table statistics: extent size, the selectivity of
each field, block counts. TUNE TABLE measures those from the
current data. It is worth running after a table has changed volume by an
order of magnitude, after the first real data load on a new system, and after
a migration that moved data in with statistics left at their defaults.
Then comes the part that trips people up. New statistics do not reach a plan that has already been built. The cached queries are still holding plans derived from the old numbers, so the same statement stays just as slow and it looks as though tuning did nothing.
That is what %RECOMPILE_CQ is for. Run with that option,
Tune Table recompiles the cached queries affected by the tables it has just
measured, so the new statistics actually get used. The tool exposes it as an
option when you start a Tune Table run, alongside the choice of a single
table or the whole schema.
The order matters. Gather statistics, recompile the cached queries, then measure again. Skipping the middle step is the most common reason a tuning session appears to have no effect at all.
There is a second reason a tuning session appears to have done nothing, and the field selectivity view now names it. Recent IRIS versions keep tuned statistics outside the class definition; the Notes column says where each value came from — a measurement from Tune Table, or a value fixed in the class definition that overrides a newer measurement. The second case is the usual answer to "I tuned and nothing changed", and it is not something you can see from the numbers alone.
Indexes
From the scan findings, the two common fixes are adding the index behind an unindexed foreign key and dropping an index another index already covers. Both are DDL, both are your decision, and both want a cached query recompile afterwards for the same reason as above.
How big is that table, actually?
SELECT COUNT(*) on a 400-million-row table is not a way to learn
a table's size. It is a way to occupy the instance for several minutes and
get one number.
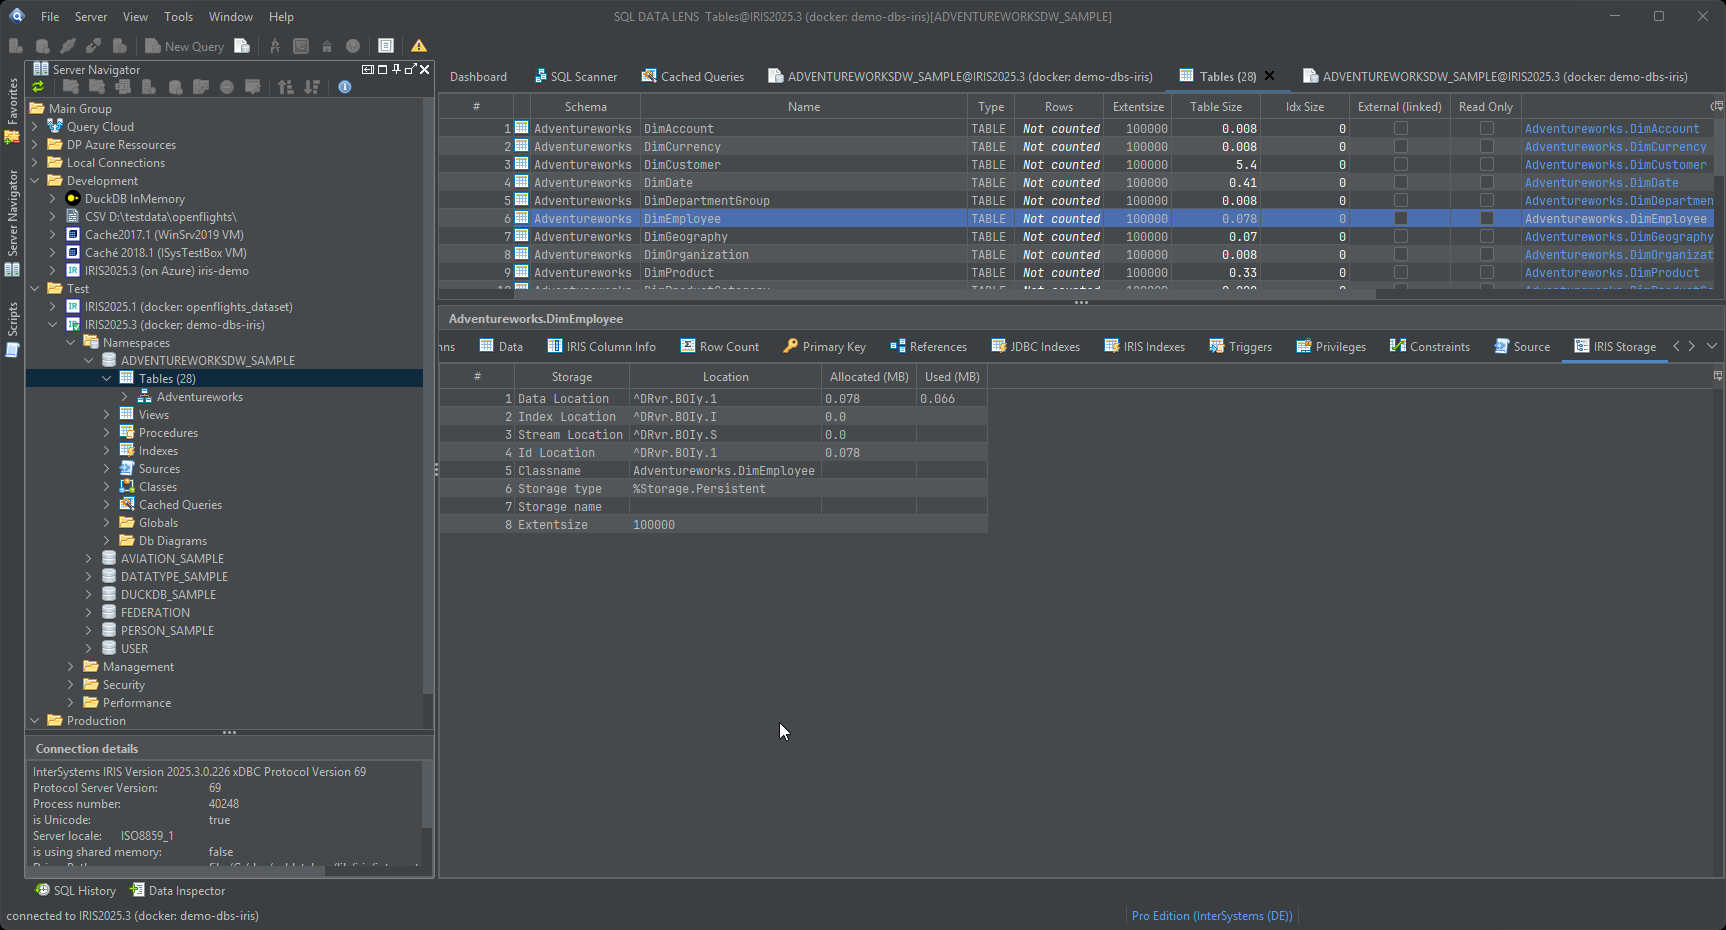
Instead, SQL DATA LENS reads the storage side directly: which globals a table maps to, how much space those globals occupy, and which database the storage actually lives in — which is not always the database you assume, once subscript-level mapping is involved. That gives you the two facts a performance conversation needs early: the real size of the data, and where on disk it sits.
If you want to go one level further down and read the global contents themselves, that is the Global Browser. For the process, lock and log side of a slow system — who is blocking whom right now — see Administration.
Step 4: verify
Re-run the profile on the same statement and compare it with the run you kept from step 2. Check that the plan changed in the way you expected, and that the cached query you purged has been rebuilt. A fix you cannot demonstrate is a fix you will be asked about again next quarter.
Questions people ask before running this
Does the scanner change anything in my database?
No. The scanner and the cached query analyser only read: catalogue and metadata, the cached query list, statement statistics, stored execution plans, and — on the Deep profile — samples of table data. Reading a stored plan or sampling rows never runs or changes anything on the server. Nothing is created, altered or dropped, and no findings are written back.
Every corrective action is a separate, explicit step you take: clearing a cached query, running TUNE TABLE, creating or dropping an index. The tool will generate the statement for you, but you decide whether to run it.
Do I need elevated privileges to run the analysis?
You need enough rights to read the SQL catalogue and the system tables behind the cached query and statement lists. A read-only account with SELECT on the relevant INFORMATION_SCHEMA and %SYS-side views is usually sufficient for the read-only parts.
The write actions have their own requirements: purging a cached query, running TUNE TABLE and creating or dropping an index each need the corresponding privilege on the table or namespace. If your account cannot do them, the analysis still works — you get findings and hand them to whoever can apply them.
Can I run this against a production instance?
Yes, and since the scan profiles arrived you can say how far it may go. Quick reads server catalogues only and is unobjectionable on a production instance. Standard adds stored execution plans and execution counters — still no table data. Deep additionally samples rows, which is the one to plan a window for on a very large table.
Clearing a cached query is a write action, and it is always an explicit choice: it causes the next execution of that statement to re-prepare, which costs a fraction of a second and produces a new plan. Running TUNE TABLE on a large table also reads data and takes time, so treat it like any other maintenance job.
Which edition do I need?
The SQL Scanner needs a paid licence — Named User or above. There is no reduced Free Edition variant of it: either a run is allowed or it does not start, and the message names the edition required. It is the feature that demonstrates how deep the IRIS support goes, and it is priced accordingly.
The rest of this page is not gated. Execution plans, the cached query analyser, PTools profiling, IRIS execution statistics and the table and global sizes work in every edition, on any database that edition is allowed to connect to. See pricing.
Why not just use the Management Portal for this?
You can, and for a single lookup that is often the fastest route. The difference is the round trip: the portal splits index definitions, cached queries, statement statistics and table sizes across several screens, and none of them sit next to the editor where you are writing the query. Here the scan results, the plan, the profile and the statement are in one window, so the find-fix-verify loop stays in one place.
Try it on your own namespace
Point the scanner at a namespace you already suspect and read the findings — that first list is usually enough to know whether the rest of this page is relevant to you. The scanner needs a paid licence, and the download includes a full 30-day trial of it, with no registration. Plans, the cached query analyser, PTools and the execution statistics are in every edition, trial or not.
Explore your IRIS data from SQL down to globals
Download, unzip, connect. Your first namespace is on screen in about three minutes.
Windows 10, 11 and Windows Server (64-bit) · ~132 MB · version 4.02 · full 30-day Pro trial included