
Deep dive
What “optimised for InterSystems IRIS” actually means
Every database tool claims to support InterSystems IRIS. This page is the specific version of that claim: the information SQL DATA LENS surfaces because it knows what IRIS is, and which a generic JDBC client has no way of asking for.
InterSystems IRIS keeps one integrated data dictionary that can be reached through several data models at once. The same information can be a table, an object, a multidimensional array or a document. Underneath all of it, data lives in sparse, tree-structured multidimensional arrays called globals — and globals are what make the SQL and object interfaces fast, and what make dynamic types like XML and JSON straightforward to store.
A JDBC driver exposes the SQL projection of that model and stops there. It is
a perfectly good view for writing a SELECT. It is not enough when
you need to know why the SELECT is slow, what the optimiser
believes about your data, or what is really stored in a column that SQL
reports as a string.
Table statistics: what the optimiser thinks it knows
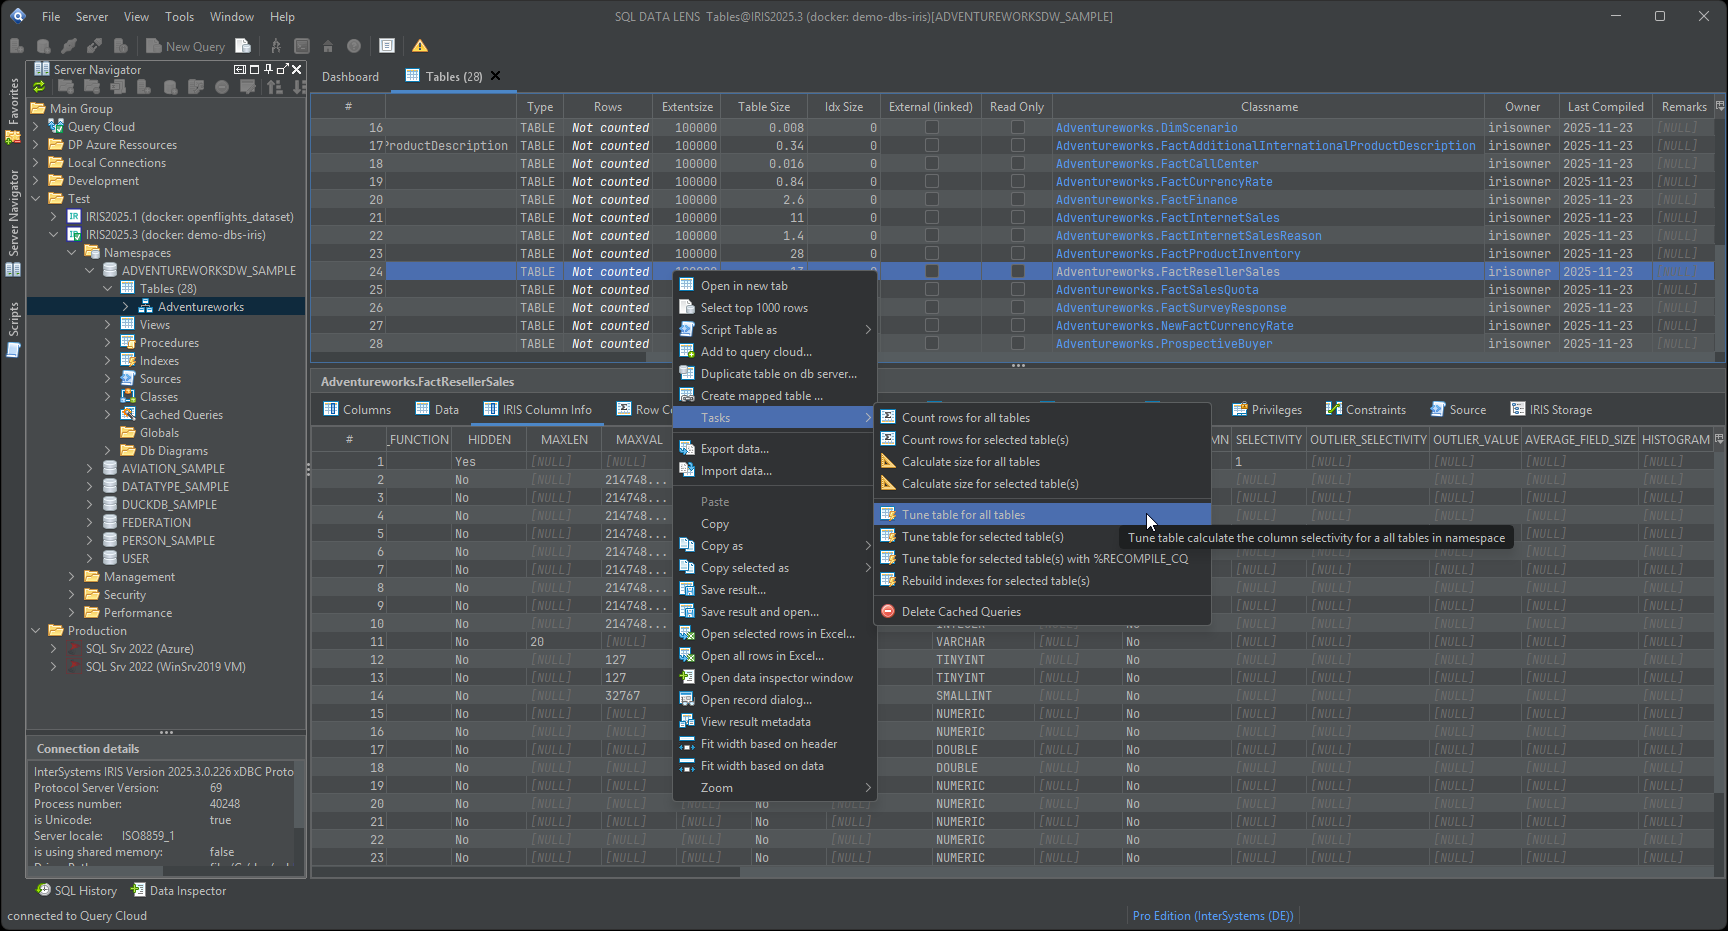
IRIS and Caché periodically examine table data and collect statistics in an operation called Tune Table. Those statistics decide the query plan, so when a query suddenly goes slow, the statistics are one of the first places to look. SQL DATA LENS shows them in the table view rather than making you query system tables by hand:
- Extent size — the number of rows IRIS believes the table
holds. Worth knowing because
SELECT COUNT(*)on a several-hundred-million-row table is not a viable way to answer the same question. - Table and index sizes — where the storage actually is, and how big each index has grown.
- The exact class name behind the table in the multi-model dictionary. Every SQL table in IRIS is also a class, and the moment you need to look at storage or read the class definition, you need its real name.
Selectivity, and why the outlier matters more
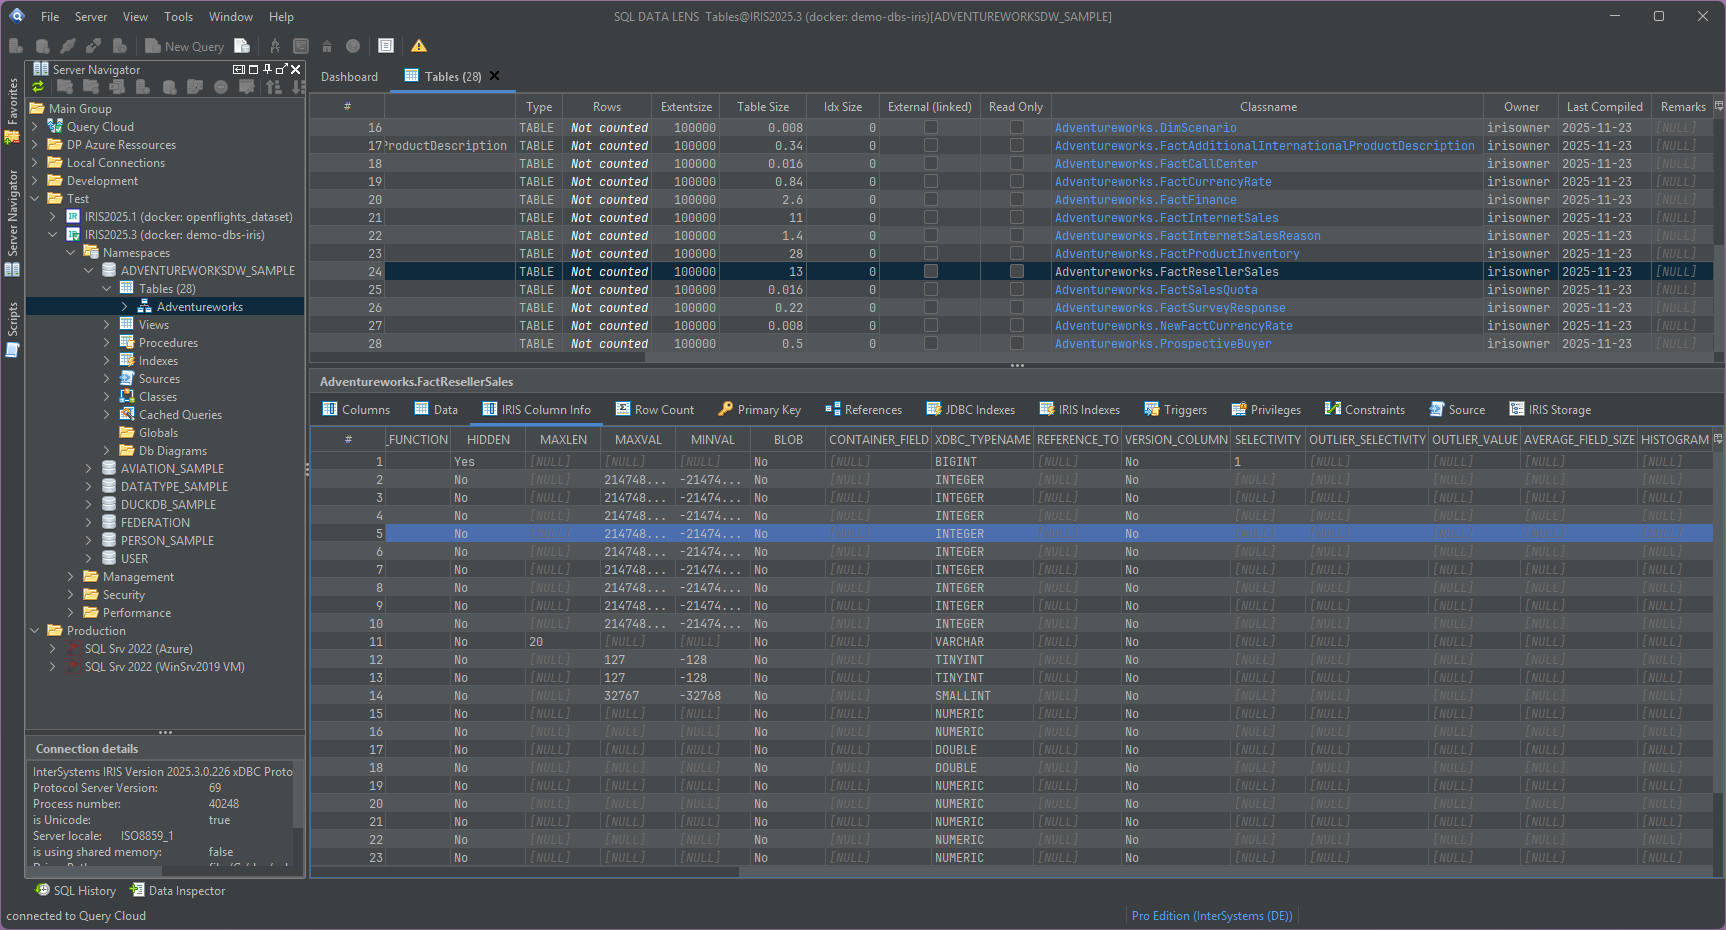
Every column in an IRIS table carries a selectivity value: the
proportion of rows a query would return when looking for a typical value in
that column. It is computed as 1/D, where D is the
number of distinct values. A column with selectivity near 1 is useless as an
index; a column near zero is excellent.
The more interesting numbers sit one level deeper, on the
IRIS Column Info tab: outlier_selectivity,
outlier_value and average_field_size. An outlier is
the classic reason a query is fast for most inputs and pathological for one —
a status column where 98 % of rows say COMPLETE, for instance.
The optimiser knows this. Without a tool that shows you, you do not.
Indexes and storage: the globals behind the table
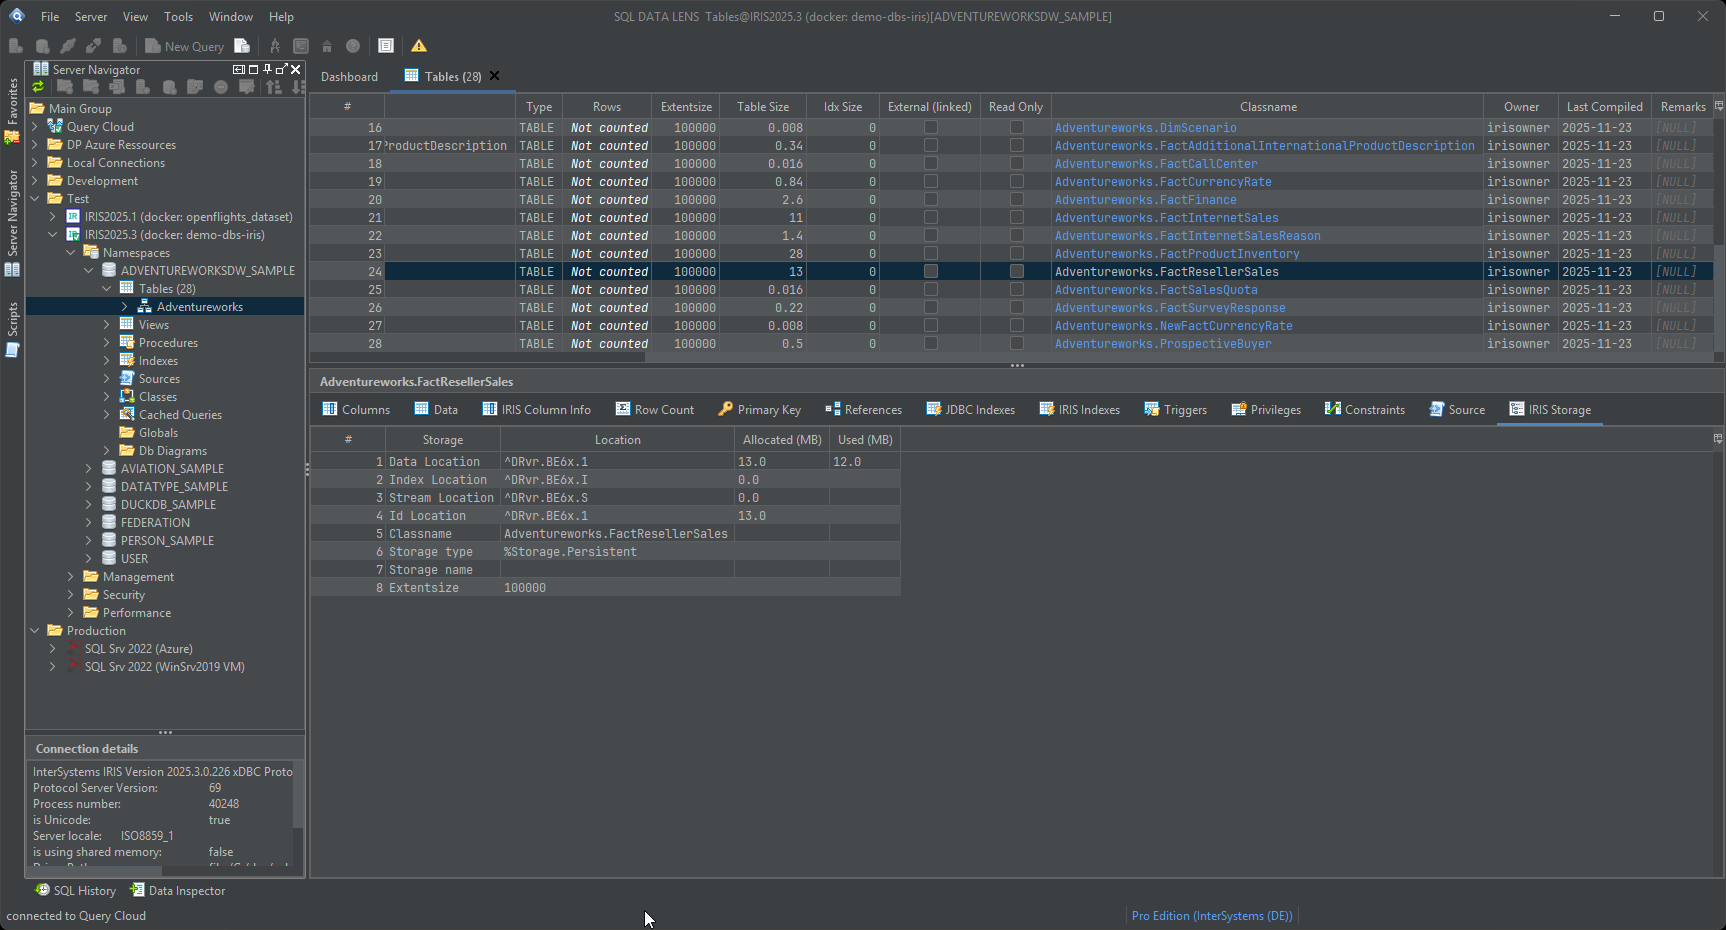
The IRIS Indexes and IRIS Storage tabs show the internal global names, structure and sizes that back a table. This is the bridge between the SQL world and the physical one: you can see which global holds the data, which globals hold the indexes, and how much space each is consuming — then open the Global Browser and look inside it.
Reading what globals actually contain
IRIS and Caché store data elements in a compact binary representation built by
the $LISTBUILD family of functions. Read a global with a generic
tool and you get a value that looks like line noise. The
Global Browser decodes it into
individual elements, walks subscript levels, and reports mixed data types and
invalid list formats instead of failing on them.
This is the single clearest illustration of the difference. Two tools connect to the same database; one shows you a string of control characters, the other shows you the fields.
And the connection itself
Optimisation also means not making the platform's history your problem. 9 InterSystems drivers ship inside the application — 8 IRIS versions from 3.3 to 3.11.0 plus Caché 2018.1 — each loaded in an isolated classloader. A Caché 2018 server and a current IRIS instance can be open side by side in one session, which matters a great deal during a migration and is genuinely awkward to arrange in a generic client.
Namespaces are listed for you rather than configured by you: connect to a server and every namespace appears in the tree, without knowing their names and without a separate JDBC URL for each one.
Look at your own statistics
Install it, open the table that has been bothering you, and read the numbers the optimiser is using. That usually takes under five minutes.
Windows 10, 11 and Windows Server (64-bit) · ~132 MB · version 4.02 · full 30-day Pro trial included